

You can use inspection windows to observe the current state of an agent during model simulation. Starting with version 8.9.6, AnyLogic supports the customization of inspection windows, making them more useful and flexible.
To enable an inspection window for an agent
- Open the diagram of the agent type.
- Ensure that an icon is drawn drawn. If the agent has no icon, draw one using a shape; for example, use a Rectangle element.
- Make this shape a part of the agent icon by selecting the Icon check box in its properties.
- To enable an inspection window for this shape when the user clicks on it, go to the Advanced section of the shape’s properties and enter return true; in the On click field. Shapes with the On click action enabled will respond to mouse clicks and show inspection windows.
By default, the inspection window of the agent displays the result of its self.toString() function call. To customize what is shown in the inspection window, you can:
- Override the toString() function for the agent type, or
- Add an Inspection window element for that agent within the top-level agent.
To customize the output of the toString() function call for an agent
- Open the properties of the agent type.
- In the Advanced section, click Create toString() function with parameters.
-
A new Function element named toString will appear on the graphical diagram of the agent. Check the area to the left from the axis origin. AnyLogic automatically generates the function body, enabling the function to return any parameters and their values present in the agent type.
Click the Function element on the graphical diagram of the agent to open its properties.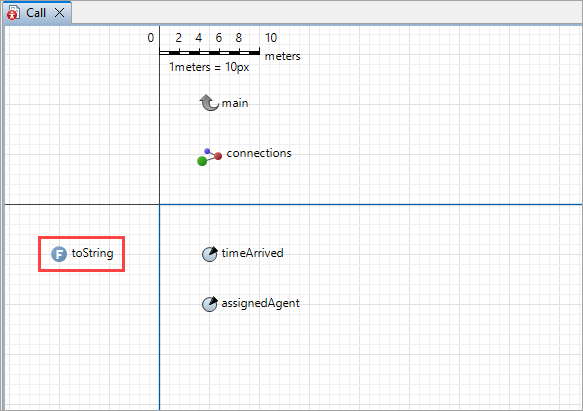 A toString function on the graphical diagram of the agent
 - In the box in the Function body section, customize the output of the function as you see fit.
To modify the contents of the inspection window
-
Drag the
 Inspection window element from the
  Presentation palette onto the graphical diagram.
Position the window carefully, as this is where it will be initially located during runtime. - Expand the Inspection window section.
- Open the properties of the inspection window.
- In the Inspection window section, modify the Inspected element property to point at your agent.
-
In the Inspection window text edit box, modify the output as you see fit.
For example, if you have a Worker agent with a parameter WorkerSpeed, and the processing time is a parameter on the Main agent, you could display both values like this:
"Worker speed: " + element.WorkerSpeed + "\nProcessing time: " + ProcessingTime
Use the element keyword to access parameters that belong to the agent being inspected. For parameters that are located in the same agent from which the inspection window is called, reference them directly by their name.
Make sure the result is explicitly converted to a String: you can use "" + value or String.valueOf(value). Otherwise, a type mismatch error may occur.
Now you can run your model and inspect the state of your agent population during the model simulation.
You can customize additional properties for inspection windows, including their position, size, and color scheme. For quick reference, see Inspection window.
To open an inspection window for an agent population
- Click the icon of the agent population on the presentation.
- The dialog will be shown. If needed, move it by dragging the window title.
- Resize it to the desired size by dragging the lower right corner of the window.
Blocks and markup elements also support inspection windows. For example, take a look at a block from the Process Modeling Library:
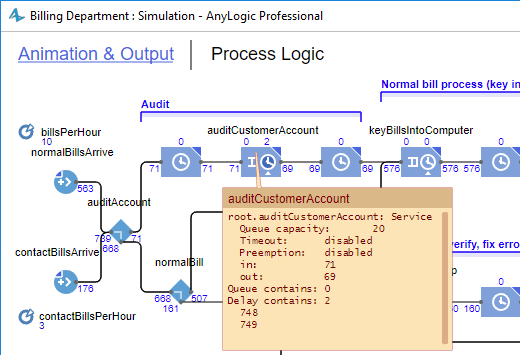 The inspection window of the Process Modeling Library's Service block
- To resize the inspection window, drag the handle in its bottom right corner.
- To reposition the inspection window, click the upper bar and move the mouse while holding down the mouse button.
-
Move the mouse pointer over the inspection window to access additional controls on its upper bar:
 — Copy the contents of the inspection window to the clipboard.
 — Close the inspection window.
-
How can we improve this article?
-